Technical Overview
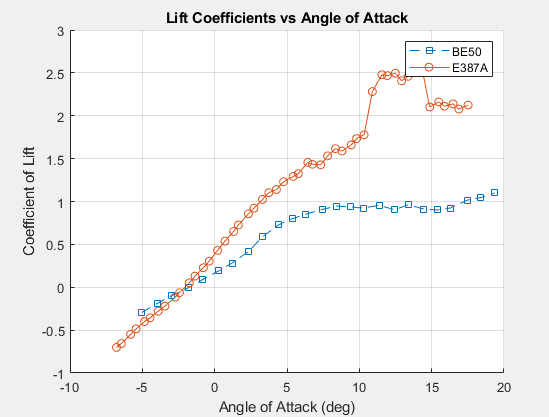
- Built foundational understanding of lift, drag, and stall behavior by reducing raw wind-tunnel lift-force data for two reference airfoils into comparative lift-coefficient curves before starting the redesign (see Supplementary Data Analysis below).
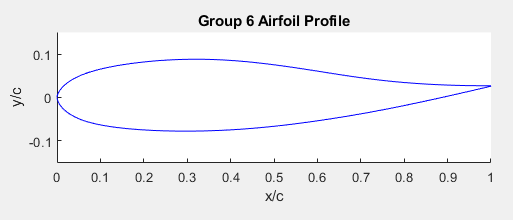
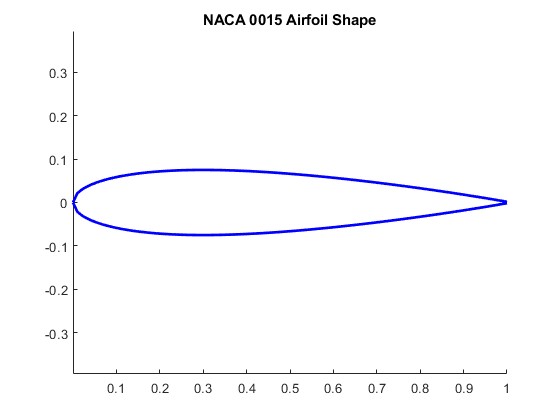
- Designed a custom airfoil in XFLR5, starting from a NACA 0015 baseline, targeting a higher stall angle and lower drag across the operating range.
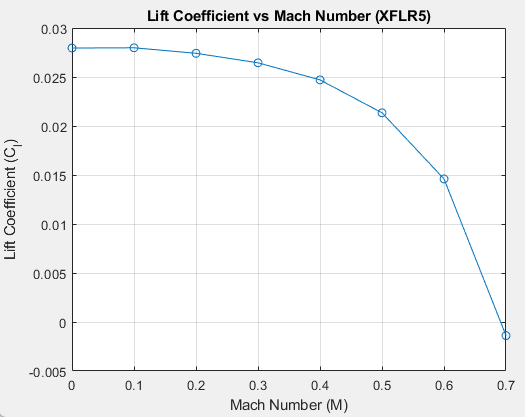
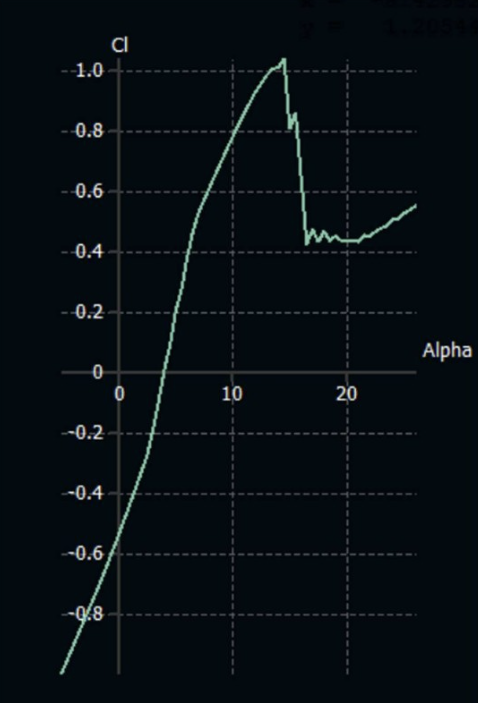
- Analyzed the profile computationally in XFoil to characterize lift and drag behavior before committing to a physical test article.
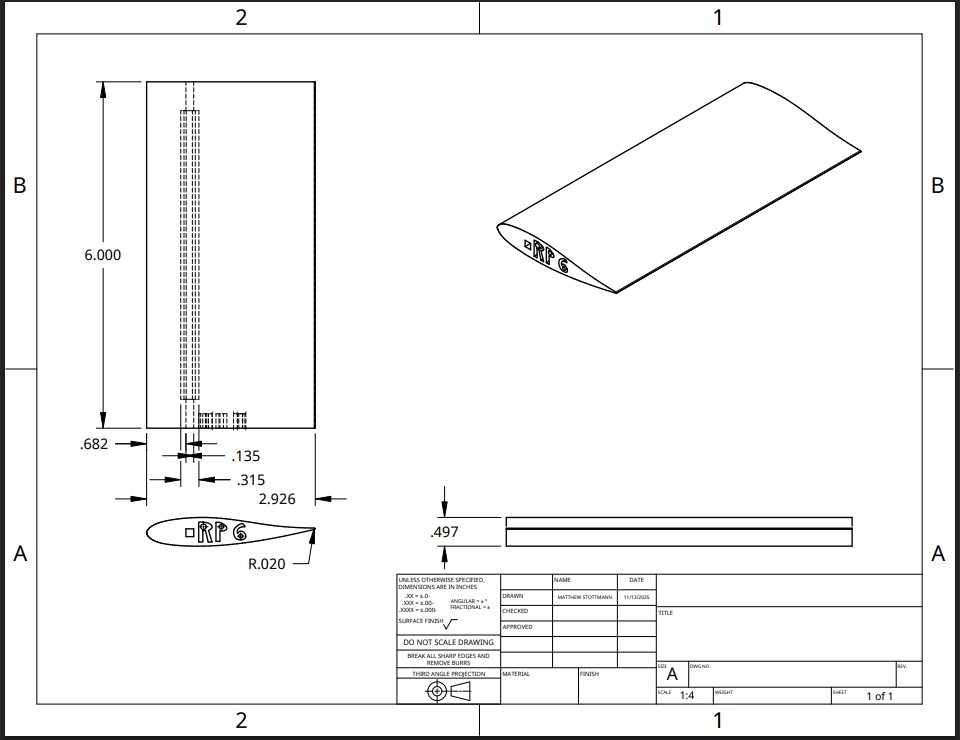
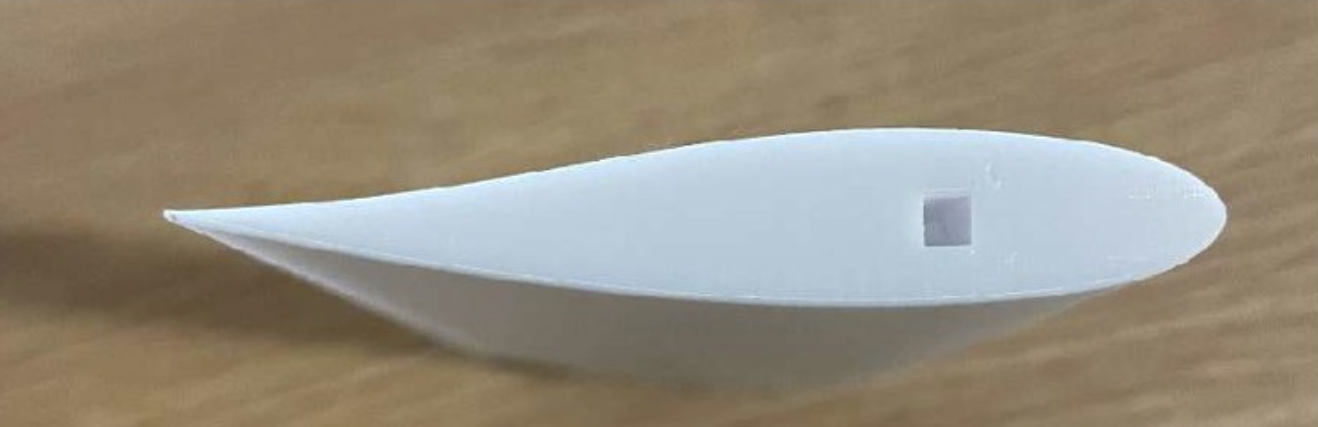
- Manufactured the finalized profile in SolidWorks, 3D printed it with PrusaSlicer, and validated it through scaled wind-tunnel testing.
- Compared theoretical, computational, and experimental data to identify sources of error and assess aerodynamic efficiency.
- Achieved a 5-degree (45%) increase in stall angle over the NACA 0015 baseline, drag coefficient reductions up to 40%, and lift coefficient improvements up to 30%.
Skills & Hardware
- XFLR5 (Airfoil Design)
- XFoil (CFD)
- SolidWorks / PrusaSlicer (3D Printing)
- Wind-Tunnel Testing
Build Gallery
Supplementary Wind-Tunnel Data Analysis
Before redesigning an airfoil of my own, I built intuition for lift and stall behavior by reducing raw wind-tunnel lift-force data for two reference airfoils — a BE50 section and the Eppler 387A — into comparative lift-coefficient curves, computing CL = L / 0.5ρV²S from each test's density, velocity, and reference-area conditions.